When your monitoring tool punishes customers for doing the right thing
A week ago we ran an experiment where a coding agent tried to resolve alerts on our validation fleet using only our own documented guidance. The experiment surfaced three real gaps in our alert design. We fixed all three, shipped them, and considered the work done.
Then we ran a follow-up: actually clean up the fleet. Apply our guidance to every active alert. Observe what happens.
The follow-up surfaced two bugs the first experiment had not. Both fall into the same shape: the customer follows our guidance, does the right thing, and our monitoring punishes them for it.
The cache that held too long
The validation fleet has seven boxes. The cleanup work was nominally simple: enable ufw where it was missing, install unattended-upgrades where it was disabled, harden SSH where the config still permitted password root login. Standard sysadmin hygiene with a clear concrete fix per alert.
The cleanup ran. The fixes worked. But the alerts kept firing.
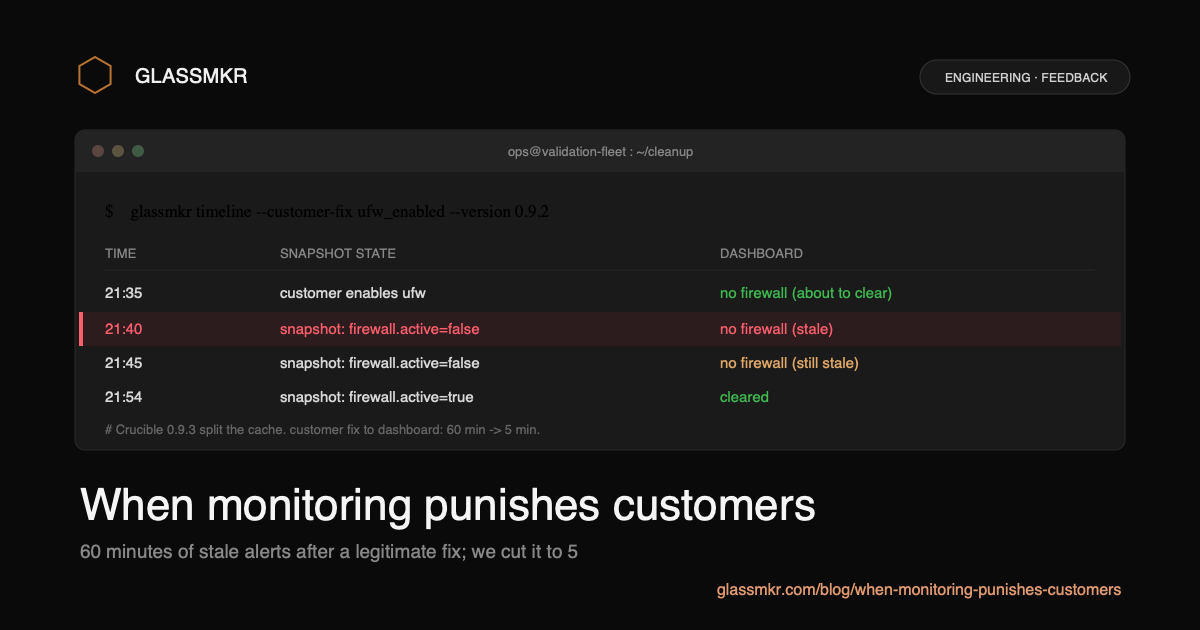
A customer would have enabled ufw, watched the dashboard, seen the no_firewall alert still active in the next snapshot. And the snapshot after that. And the one after that. They would have thought: "Did the fix not take? Let me check ufw status again." They would have run sudo ufw status. It would have said Status: active. They would have looked back at the dashboard. The alert would still be firing.
For up to 60 minutes after the fix.
The root cause, when we found it, was straightforward and embarrassing. Our agent (Crucible) collects security-related state in a single block: firewall status, SSH config, unattended-updates status, pending security updates count. The pending-updates check is genuinely slow: it queries the apt or dnf metadata cache, which can take seconds on a busy system. To keep collection cheap, we had cached the entire security block at one-hour cadence.
The intent was reasonable: do not query apt every five minutes. The implementation was wrong: do not cache the firewall config alongside the pending updates count. The pending updates count changes hours apart. The firewall config can change in seconds, the moment a customer enables ufw. Caching them together meant that legitimate, fast-changing state was being held stale to subsidise a slow check.
From the customer's view there was no signal of a cache at all. They saw "I fixed it" and "the dashboard still says broken." The natural next question is: "Is the dashboard wrong, or am I?" Both answers erode trust in the product.
The fix was a one-cache-extraction change. The cache moved out of the top-level security collector and into the specific sub-check that needed it. The pending-updates query still caches at one-hour cadence. Everything else runs every five minutes. The latency between customer fix and alert clearing dropped from "up to 60 minutes" to "5 minutes" (one ingest cycle). We shipped this as Crucible 0.9.3.
The reboot that fired its own alert
The second bug found us in a different way.
Our kernel_needs_reboot rule fires when a Debian-family or RHEL-family box has applied a kernel update without yet rebooting to use it. The documented fix is simple: schedule a maintenance window and reboot. Our guidance had said this for as long as the rule had existed.
We rebooted six boxes during the cleanup. Each came back cleanly. Each updated to the new kernel. The kernel_needs_reboot alerts on those boxes cleared. Six wins.
Then the dashboard fired six unexpected_reboot critical alerts.
From the agent's perspective, this was working as designed. unexpected_reboot exists to flag situations where a box came back from an unscheduled reboot, which can indicate a crash, a power event, or a kernel panic. The agent suppresses the alert when it sees a marker file written by an operator before a planned reboot. The marker file is created by a single command: sudo glassmkr-crucible mark-reboot.
We had documented the reboot. We had not documented the marker.
From the customer's perspective, this is the same shape as the cache bug. The customer reads "your kernel is outdated, please reboot." The customer reboots. The dashboard responds with a critical alert. The natural next question is: "Did I do something wrong?" The answer is no. The customer did exactly what we told them. We just forgot to mention the suppress command.
The fix here was even smaller than the cache fix. One sentence added to the rule's documentation, cross-linking the mark-reboot command as step zero before the reboot itself. Five minutes of doc work for a bug whose customer-experience impact was real.
Both bugs share a shape
The cache bug is a caching design mistake. The mark-reboot bug is a documentation gap. They look entirely different. They come from different parts of the codebase. The teams that own them are different teams (one is agent code, one is docs).
But from a customer's view they are identical. The customer reads our dashboard. The dashboard tells them to do something. They do it. The dashboard punishes them for it.
This shape is worth taking seriously because the customer's response to it is the same response in both cases: stop trusting the dashboard. Once a customer learns that "I fixed it but it still says broken" is something the dashboard does, they will start ignoring alerts even when those alerts are legitimate. Trust in a monitoring tool is built or eroded one false alarm at a time.
The remediation is therefore not just "fix the bugs" (which we did), but also "audit for other instances of this shape" (which is harder). The audit is ongoing. Some questions we are asking ourselves:
- Where else might agent-side caching hold customer-actionable state stale?
- Where else does our docs describe a fix without mentioning the agent-side coordination?
- Where else does an action on the customer side trigger an alert on our side that suppresses cleanly with another action they do not know about?
These are not bugs in any one place. They are a category of bug. They emerge specifically when you have a feedback loop between customer state and your own monitoring, which is the whole game in our product.
Latency dropped, trust gradually rebuilds
The cache fix shipped in Crucible 0.9.3 and propagated to the validation fleet within one upgrade cycle. The next round of fleet cleanup we did, the fixes cleared their alerts at the very next ingest. From 60 minutes to 5 minutes, then to "essentially as fast as the cycle allows." That feels right.
The mark-reboot cross-link shipped as a one-line addition to /docs/alerts. We have not yet had to reboot a box again, so we have not yet seen the post-fix shape in production. We will.
The bigger commitment is the audit. Both of these bugs were caught not by the experiment that found the three evidence-shape gaps, but by the follow-up work of actually applying the fixes. The pattern is: experiments find what is wrong with the surface; cleanups find what is wrong with the loop. We are running more cleanups.
If you operate monitoring software (or any product where customer state and your product's view of customer state are in a feedback relationship), the same shape will exist somewhere in your product. The way to find it is to actually use the product as a customer would, end-to-end, fix to feedback. Not just docs review. Not just usage in normal operations. Specifically: take an action your dashboard told the customer to take, and watch what your dashboard then says.