Why bare metal monitoring is different
Cloud monitoring tools were built for ephemeral workloads. They track HTTP latency and container restarts. But when you run physical servers, the failure modes are fundamentally different: drives wear out, DIMM slots develop bit errors, fans fail silently, and RAID arrays degrade without anyone noticing.
Cloud assumptions do not apply
In a cloud environment, the infrastructure is someone else's problem. If a VM host has a failing drive, AWS replaces it. If a network switch drops packets, Azure reroutes. Your monitoring focuses on application behavior because that is what you control.
On bare metal, you own the full stack. A degrading NVMe drive does not send you an email. A fan spinning down from 8000 RPM to 2000 RPM does not trigger a PagerDuty alert. An IPMI sensor reading 85C on a CPU does not appear in your Grafana dashboard unless you built the check yourself.
Failure modes that matter
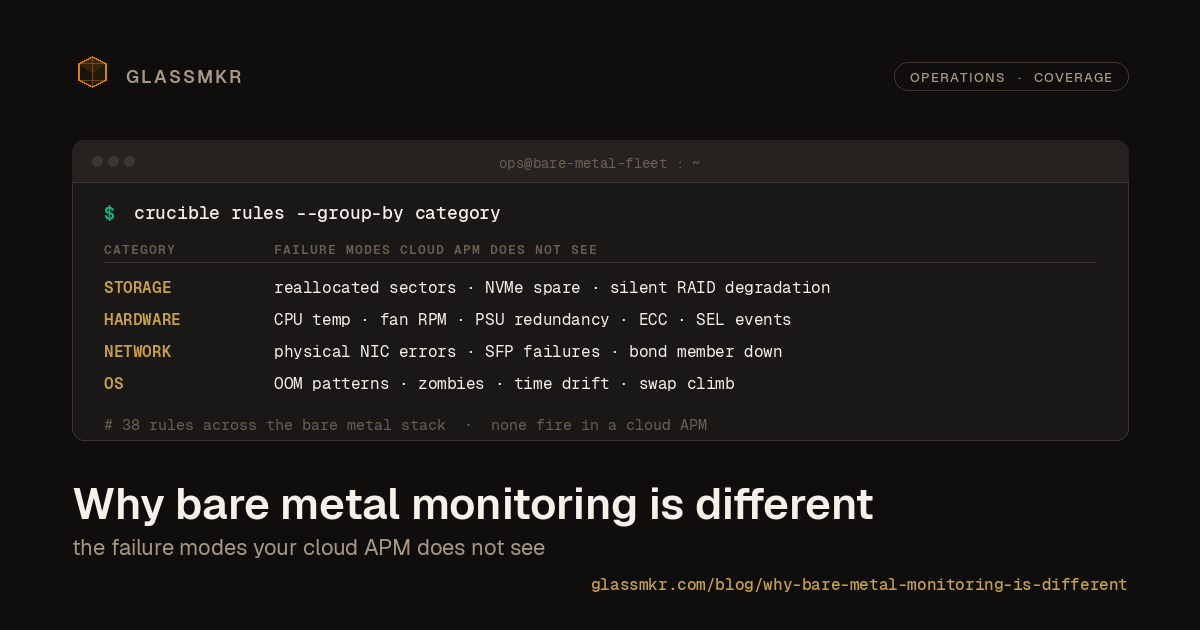
After a decade of operating bare metal across 60+ locations, we have seen the same patterns repeat. These are the categories of failure that cloud monitoring tools completely miss:
Storage degradation is gradual
Drives rarely fail suddenly. An HDD develops reallocated sectors over weeks. An SSD's wear leveling counter ticks down predictably. NVMe drives report available spare capacity that decreases over their lifespan. SMART data tells you exactly when a drive is approaching end of life, but only if something is reading and alerting on those attributes.
RAID makes this worse. A degraded RAID array continues serving data normally. There is no performance impact, no application error, no user-visible symptom. But your redundancy is gone, and the next drive failure means data loss.
Hardware sensors need context
An IPMI temperature reading of 72C means nothing without context. Is this a CPU? Normal under load. An inlet temperature? Your cooling failed. A VRM? Check your airflow. A drive bay? Potentially dangerous.
Generic monitoring tools that alert on "temperature > threshold" generate noise. Effective hardware monitoring needs to understand what each sensor means and what the appropriate response is.
Network errors are physical
In the cloud, network issues mean configuration problems or capacity limits. On bare metal, network errors often have physical causes: a loose cable, a failing SFP transceiver, a bad port on a switch. RX errors on a bonded interface might mean one member has a cable problem while the bond continues functioning at reduced capacity.
These problems are invisible to application monitoring. Your service responds normally, just on a degraded link that could fail completely at any time.
OS-level signals get ignored
OOM kills happen and applications restart. Zombie processes accumulate. Time drift creeps in. Kernel security mitigations get disabled for performance. Swap usage slowly climbs. Each of these is a signal that something needs attention, but individually they rarely cause outages. Together, they paint a picture of a server heading toward trouble.
GPU and accelerator degradation is its own taxonomy
If you run inference, training, or any GPU workload on bare metal, the failure modes are different again. NVIDIA XID errors land in dmesg with cryptic codes that map to specific hardware faults: XID 79 is GPU fallen off the bus, XID 48 is double-bit ECC, XID 13 is graphics engine error. Generic monitoring treats them as log spam. ECC counters (correctable and uncorrected) drift up over the card's lifetime and predict failure long before the GPU goes offline. NVLink topology changes silently when a link drops out: the GPU is still present, but tensor-parallel workloads suddenly serialize across the surviving links. PCIe link-speed downgrades from Gen4 x16 to Gen3 x8 silently halve throughput, often after a thermal event reseated the link. Power-cap throttling shows up as quiet utilization drops, not errors. Driver and firmware drift across a fleet creates inconsistent behavior that's almost impossible to diagnose without per-node version visibility.
None of these signals appear in a cloud APM. Most don't appear in vendor management tools either unless you're paying for the enterprise tier. We have written separately about how this taxonomy applies to a real GPU server: the same L4 box that runs our self-hosted inference is also a fleet member that surfaces every one of these signals.
What we built
This is why we built Glassmkr. The open-source agent (published on npm as @glassmkr/crucible v0.13.3 at time of writing, and on Docker as ghcr.io/glassmkr/crucible) is specifically built for the failure modes that bare metal operators encounter. 62 alert rules across 9 categories (storage, ZFS, filesystem, memory and CPU, network, hardware and BMC, time and services, security and patching, and GPU), each one based on a real incident we have dealt with. 30+ rules are verified end-to-end on real hardware. No configuration required because the thresholds come from operational experience, not guesswork.
The hosted dashboard gives you fleet-level visibility, historical trends, and managed alerting. But the core insight is the same: bare metal monitoring needs to be purpose-built, not adapted from cloud tooling.