IPMI, SMART, and RAID: the hardware monitoring gap
If you run physical servers, your monitoring stack almost certainly has a blind spot. Most observability platforms start their coverage at the operating system: CPU utilization, memory pressure, disk space, process health. These are useful signals. But the hardware layer underneath the OS is what ultimately determines whether your server stays online, and that layer is where the most consequential failures begin.
A drive does not fail between one health check and the next. It degrades over weeks, accumulating reallocated sectors, reporting rising temperatures, and quietly exhausting its spare capacity. A RAID array can lose a member disk and continue serving reads and writes without a single application error. A CPU can run at 95C for days because a fan failed and nobody was watching the IPMI sensor. These are not edge cases. They are the normal failure progression on bare metal infrastructure, and they are invisible to any monitoring tool that only talks to the OS.
What lives below the OS
Three subsystems provide health data about physical hardware, each with its own protocol, tooling, and failure semantics. Understanding them is the first step toward closing the monitoring gap.
IPMI and the baseboard management controller
IPMI (Intelligent Platform Management Interface) is a specification for out-of-band hardware management. Every enterprise server ships with a BMC (Baseboard Management Controller), a small embedded system that runs independently of the host OS. The BMC has its own network interface, its own firmware, and access to dozens of hardware sensors: CPU temperature, inlet and exhaust air temperature, fan speeds, power supply status, voltage rails, and memory health.
You interact with the BMC through ipmitool on the host, or over the network via IPMI LAN. Each server vendor ships their own BMC implementation with its own web interface: Dell iDRAC, HP iLO, Supermicro IPMI, Lenovo XClarity. The underlying sensor data is standardized enough that ipmitool sdr returns a consistent list of sensor readings across vendors.
The BMC also maintains a System Event Log (SEL) that records critical hardware events: ECC memory errors (both correctable and uncorrectable), power supply redundancy loss, PCI bus errors, and thermal shutdowns. This log persists across reboots and OS reinstalls. It is the black box recorder for your server, and most monitoring setups never read it.
SMART and drive health
SMART (Self-Monitoring, Analysis and Reporting Technology) is built into every HDD, SSD, and NVMe drive manufactured in the last two decades. The drive firmware tracks internal health metrics and exposes them through a standard interface. On Linux, smartctl reads these attributes.
The attributes that matter vary by drive type. For HDDs, watch reallocated sector count, current pending sector count, and seek error rate. For SATA SSDs, monitor wear leveling count, program fail count, and erase fail count. For NVMe drives, the critical attributes are percentage used, available spare, and media errors. All drives report temperature and power-on hours.
SMART also provides a binary overall health status. When the drive firmware determines that failure is imminent, it sets the health status to "FAILING." This is the last warning before data loss. But by the time this flag is set, the drive may already be unreliable. The individual attributes give you far more lead time if you monitor them continuously.
RAID and array health
Software RAID (managed by mdadm on Linux) and hardware RAID controllers add a layer of redundancy that makes drive failures survivable. A RAID 1 mirror or RAID 5/6 array can lose one or more member disks and continue operating normally. The problem is that "operating normally" means your applications see no errors, your users notice no downtime, and your monitoring reports green across the board.
A degraded RAID array is a time bomb. Your redundancy is gone. If another drive in the array fails before the rebuild completes, you lose data. Rebuilds themselves are dangerous because they stress every surviving drive with sustained sequential reads, which is exactly the kind of workload that exposes latent defects. The longer a degraded array goes unnoticed, the higher the risk.
mdadm --detail reports array state, active devices, and rebuild progress. cat /proc/mdstat gives a quick summary. Both are trivial to check, yet surprisingly few monitoring setups include them.
GPU and accelerator telemetry
If you run GPU workloads, the failure surface expands again. NVIDIA GPUs expose health and error data through nvidia-smi (every driver install) and DCGM (data center GPU manager, for the deeper telemetry). The signals that matter, none of which appear in OS-level monitoring: XID error codes in dmesg (cryptic numeric identifiers for specific hardware faults; XID 79 is GPU fallen off the bus, XID 48 is double-bit ECC, XID 13 is graphics-engine error), ECC counters both correctable and uncorrected, PCIe link speed and width (a Gen4 x16 link that downgrades to Gen3 x8 silently halves throughput), NVLink topology and per-link status, thermal trip events, power-cap throttling that reduces utilization quietly without raising an error, retired-page counts that grow as the card ages, and driver / firmware versions that drift across a fleet. On HPE / Dell ProLiant hardware, vendor-side Redfish endpoints carry the same telemetry through the BMC; the OEM stub-parser path is how we surface those signals without locking customers into a vendor management tool.
This data is available on every GPU server, and almost none of it is in your application monitoring tool. Our own L4 inference server is monitored with the same agent; nothing about GPU monitoring lives in a different tool from the rest of the fleet.
The monitoring gap
The mainstream observability platforms were built for cloud-native workloads. Their core product is designed around application performance monitoring, distributed tracing, log aggregation, and container orchestration. Hardware monitoring, when it exists, is a secondary concern.
To be fair, the major players do offer hardware monitoring capabilities. Datadog integrates with MetricsHub for IPMI and SMART data. New Relic has partnerships with Hardware Sentry for physical infrastructure telemetry. Grafana Cloud supports community-maintained collectors for IPMI and smartctl. These are real solutions that work.
Last verified: 2026-05-21.
But they are afterthoughts, not defaults. They require additional agents, separate configuration, third-party integrations, and often a higher pricing tier. When you install the Datadog agent on a bare metal server, it does not start collecting IPMI sensor readings out of the box. You need to discover that the integration exists, configure it, verify that the right tools are installed on the host, and map the sensor data into your existing alerting rules.
The result is that hardware monitoring becomes the thing that gets set up "later" and then never gets set up at all. The server runs for months with its OS-level metrics looking healthy. Then a drive fails, and the postmortem reveals that SMART had been warning about it for six weeks. Or a CPU throttles under load because a fan died, and nobody knew because IPMI sensor data was not being collected.
Traditional infrastructure monitoring tools like Nagios, Zabbix, and Icinga can absolutely monitor hardware. They have plugins for IPMI, SMART, and RAID. But they require manual configuration for every check, every threshold, every server. If you have 10 servers, this is manageable. At 100 servers with different hardware vendors and drive models, the configuration burden becomes its own operational problem.
What good hardware monitoring looks like
Regardless of which tool you use, effective hardware monitoring shares a few characteristics.
Continuous collection, not periodic checks
Hardware degradation is a trend, not an event. A drive's reallocated sector count that jumps from 0 to 4 in a week is a very different signal than one that has been at 4 for three years. Temperature spikes that correlate with load are normal; a baseline shift of 10C over a month means your thermal paste is drying out or a fan is failing. You need time-series data, not point-in-time snapshots, to distinguish dangerous trends from stable baselines.
The right thresholds
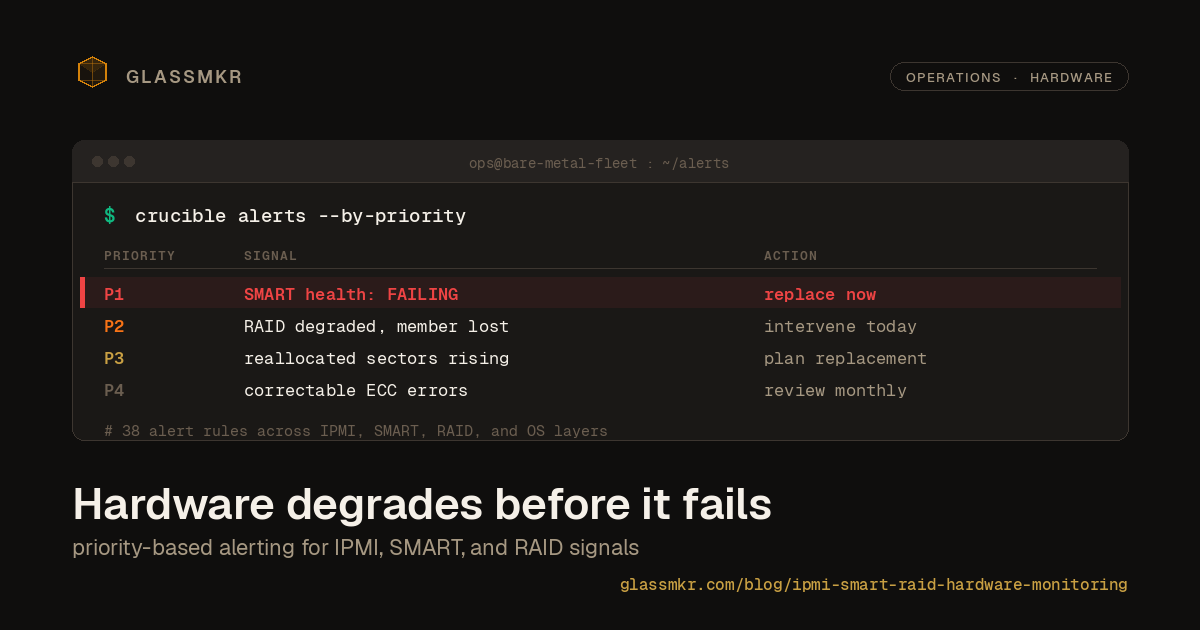
Not all hardware alerts are created equal. A good monitoring system assigns severity based on operational impact:
- P1 Urgent: Data loss is imminent or actively occurring. Examples: SMART health status FAILING, RAID array with multiple failed members, uncorrectable ECC memory errors.
- P2 High: The problem is service-impacting or will become P1 without intervention. Examples: degraded RAID array, CPU temperature exceeding safe limits, power supply redundancy lost.
- P3 Medium: Something is degrading and needs attention during business hours. Examples: rising reallocated sector count, NVMe spare capacity below threshold, fan speed dropping.
- P4 Low: Informational signals that may warrant investigation. Examples: correctable ECC errors, drive power-on hours approaching rated lifespan, SEL entries for non-critical events.
Flat threshold alerting ("temperature above X") generates noise. Priority-based alerting tells you what to fix first.
Actionable diagnostics
An alert that says "SMART check failed" is almost useless. An alert that says "Drive /dev/sda (Samsung PM883, serial SN1234, in RAID array md0) has 12 reallocated sectors, up from 0 last week. Run smartctl -a /dev/sda to inspect. Consider scheduling a replacement." gives you everything you need to act.
Good hardware alerts include the affected device, the specific metric, its recent trend, evidence links to the relevant data, and the diagnostic command to run next.
Cross-layer correlation
Hardware problems manifest at every layer of the stack. A failing drive causes elevated iowait, which causes application latency, which causes user-facing errors. If your hardware monitoring is in a separate tool from your application monitoring, you end up chasing the symptom instead of the cause.
The most useful setup puts hardware metrics, OS metrics, and application metrics in the same timeline so you can see that the latency spike at 14:32 correlates with a RAID rebuild that started at 14:30 because a drive was removed at 14:28 due to rising error rates visible in SMART data since last Tuesday.
How Crucible handles this
Crucible (v0.13.3 at time of writing) is our open-source monitoring agent, MIT licensed, built specifically for bare metal servers. It is not a general-purpose collector. It collects the data that matters for physical infrastructure health and applies 62 opinionated alert rules across 9 categories based on real operational experience.
On every collection cycle, Crucible reads from smartctl, ipmitool, mdadm, nvidia-smi, /proc, and /sys to build a complete health snapshot. SMART attributes for every drive: temperature, reallocated sectors, wear leveling, power-on hours, overall health status. IPMI sensor readings: CPU temperature, fan speeds, power supply status, voltage rails. RAID array state: active members, degraded status, rebuild progress. GPU telemetry: XID errors, ECC counters, PCIe link speed, NVLink topology, thermal and power state. OS metrics: per-core CPU, memory, swap, disk space, network interface errors.
Each of the 62 alert rules is assigned a priority level (P1 through P4) and includes evidence, diagnostic commands, and context about why the alert matters. Alerts fire through Dashboard with notifications to Slack, Telegram, or email. The AI analysis layer (Furnace) correlates alerts across the hardware and OS layers to surface root causes rather than symptoms.
There is no configuration file. You install Crucible, and it starts collecting everything relevant to the hardware it detects. If the server has an IPMI BMC, it reads IPMI sensors. If it has SMART-capable drives, it reads SMART data. If it has mdadm arrays, it checks RAID health. You do not need to tell it what to monitor.
Getting started
Crucible runs on Linux servers. Install it with a single command:
curl -sf https://glassmkr.com/install.sh | bashThe installer registers the server with Dashboard, sets up the systemd service, and begins collecting data within minutes. For the full list of alert rules and configuration details, see the rules catalog on the marketing site or the Crucible source on GitHub. If you want a deeper IPMI-specific walkthrough, see our practitioner guide to IPMI diagnostics on bare metal.
Hardware degrades before it fails
The central lesson of operating physical infrastructure is that hardware failures are almost never sudden. Drives report problems weeks before they die. Temperatures climb gradually as cooling degrades. RAID arrays lose redundancy silently. ECC memory accumulates correctable errors before producing uncorrectable ones.
Every one of these degradation signals is available through standard interfaces that have existed for years: IPMI, SMART, mdadm. The data is there. The question is whether your monitoring stack is collecting it.
Whether you use Crucible, build your own collection with Prometheus exporters, or configure IPMI plugins in your existing monitoring platform, the important thing is to close this gap. OS-level monitoring tells you how your server is performing right now. Hardware monitoring tells you whether it will still be performing tomorrow.