IPMI diagnostics for bare metal: what to monitor and how to read it
If you run dedicated servers at Hetzner, OVH, Leaseweb, or any other bare metal provider, you're probably aware that your hosting provider doesn't tell you much about the hardware underneath your OS. A server can be running 87 degrees C in your rack and your provider will only email you when it catches fire. Or when the landlord below complains about smoke.
IPMI is how you fix this. It's been around since 1998, it's in almost every enterprise server built in the last two decades, and most operators either don't use it or use it wrong. This post walks through what IPMI actually is, what to monitor, and where most setups go sideways.
What IPMI is, briefly
IPMI stands for Intelligent Platform Management Interface. It's a specification for a dedicated microcontroller called the BMC (Baseboard Management Controller) that sits on your server's motherboard and runs independently of the CPU, OS, or even whether the server is powered on. The BMC has its own network stack, its own firmware, and its own view of the hardware.
That independence is the point. When your OS hangs, the BMC still responds. When your CPU throttles from thermal runaway, the BMC knows before the kernel does. When a fan fails, the BMC logs it in a persistent System Event Log (SEL) that survives reboots and kernel panics.
Vendors implement IPMI with branded stacks on top: Dell calls theirs iDRAC, HPE calls theirs iLO, Supermicro has IPMI 2.0 and more recently Redfish. They all speak the underlying IPMI protocol, but they wrap it in their own web UIs, sometimes diverge on sensor naming, and occasionally break the spec in creative ways.
In-band vs out-of-band
There are two ways to talk to IPMI:
In-band means the OS talks to the BMC over a local interface (usually /dev/ipmi0, exposed by the ipmi_si or ipmi_ssif kernel module). This requires the IPMI kernel modules and a tool like ipmitool or freeipmi. You don't need network access to the BMC, but you do need the OS to be running.
Out-of-band means you talk to the BMC over its dedicated network interface (or shared NIC in some configurations) via IPMI over LAN, or through the vendor's web UI. This works when the OS is down, but requires network routing to the BMC's IP.
For monitoring, in-band is what you usually want. It's always reachable as long as your agent runs, it doesn't require exposing the BMC to the network, and it reads the same sensors as out-of-band. Out-of-band is for emergencies when the OS is unreachable.
Types of sensors
A typical server exposes between 20 and 100 IPMI sensors. The categories that matter:
- Temperature: CPU cores, inlet ambient, exhaust, motherboard, DIMMs, disk backplane, GPU
- Fan speed: System fans, CPU fans, PSU fans. Usually reported in RPM
- Voltage: 12V, 5V, 3.3V rails, CPU VCORE, battery backup
- Current: System current draw, per-PSU current
- Power: Total system wattage, per-PSU wattage
- Chassis: Intrusion detection, PSU presence, fan presence
- Discrete sensors: Specific OK/FAIL indicators for components
There are two flavors in the data you'll read: threshold sensors (have numeric readings and upper/lower critical thresholds set by the vendor) and discrete sensors (just state: OK, failed, absent, etc.).
What your hosting provider does and does not monitor
Short answer: they monitor whether your server responds to ping. That's it, at most providers.
Hetzner gives you SysMon, which checks ICMP and TCP ports with a six-minute delay. No hardware health whatsoever. Their AX line (their most common modern option, built on consumer AMD Ryzen hardware) doesn't have IPMI at all. This isn't a limitation of the Ryzen platform itself. Ryzen works fine with IPMI on boards that include a BMC chip, like the ASRock Rack X470D4U/X570D4U/B650D4U series, Supermicro H13SAE-MF, ASUS Pro WS B850M-ACE SE, or Gigabyte MC13. Hetzner simply chose consumer-grade boards without BMCs for their AX servers to hit a price point. Their EX Intel line and their Dell-based servers still include IPMI normally. But if you have an AX server, IPMI is not an option, and you're stuck with OS-level monitoring only.
OVH monitors ping with three intervention modes: alert only, alert and check, or alert and intervene. Their RTM monitoring agent was archived in September 2022 and hasn't been replaced. They do provide IPMI access through their control panel via a managed KVM/Java applet, which is fine for console access during emergencies but not for automated monitoring.
Leaseweb is the most complete of the major providers. They recently launched agentless IPMI-based hardware monitoring that reads temperature, power, and fan speed every five minutes, but only in Netherlands data centers. They also expose raw IPMI via OpenVPN for customers who want direct BMC access.
Vultr bare metal gives you bandwidth graphs and a VNC console. No IPMI exposure, no sensor data.
Hosting-provider policies above last verified: 2026-05-21.
The pattern is clear. Hosting providers compete on hardware and price, not software services. If you want to know your server's internals, you're collecting that data yourself.
Reading IPMI sensors with ipmitool
Install the tool:
sudo apt-get install ipmitool        # Debian/Ubuntu
sudo dnf install ipmitool            # RHEL/Rocky/Alma
sudo zypper install ipmitool         # openSUSE
Then load the kernel module:
sudo modprobe ipmi_devintf
sudo modprobe ipmi_si
Now dump sensors. This is the command you'll run most often:
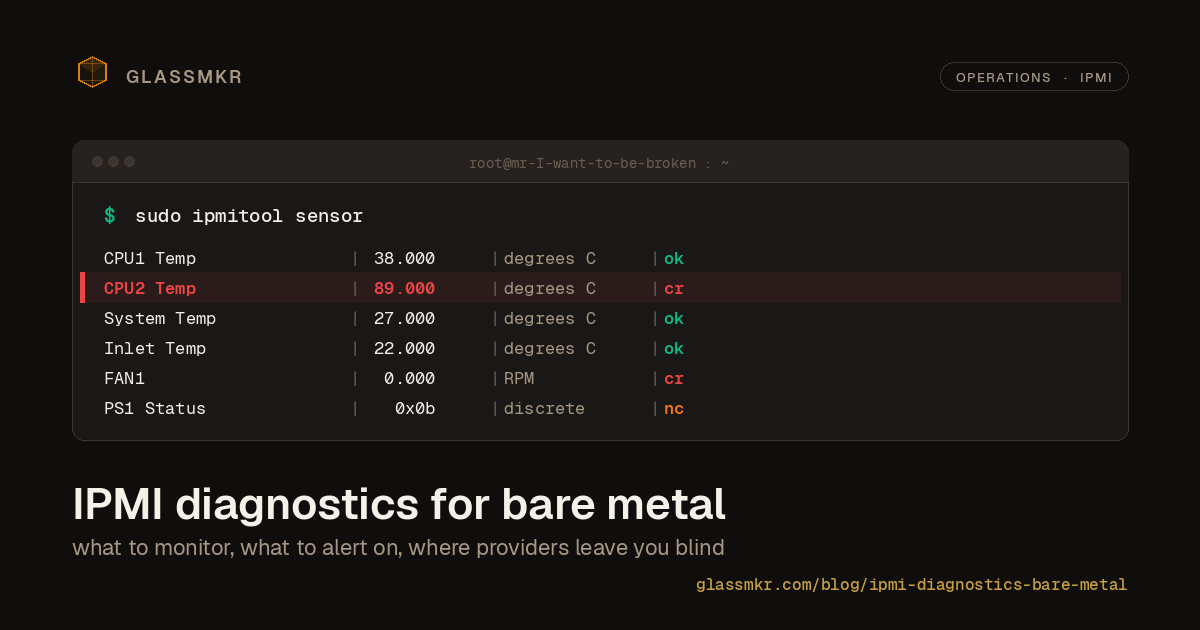
sudo ipmitool sensorThis returns a dense table: sensor name, current reading, units, status, and thresholds. Temperature sensors look like this:
CPU1 Temp        | 38.000     | degrees C  | ok    | 0.000     | 0.000     | 0.000     | 85.000    | 87.000    | 88.000
CPU2 Temp        | 40.000     | degrees C  | ok    | 0.000     | 0.000     | 0.000     | 85.000    | 87.000    | 88.000
System Temp      | 27.000     | degrees C  | ok    | -9.000    | -7.000    | -5.000    | 80.000    | 85.000    | 90.000
The status column shows ok, nc (non-critical), cr (critical), or nr (non-recoverable). The rightmost three numeric columns are upper thresholds: non-critical, critical, non-recoverable. The three numeric columns before the status are lower thresholds.
For fans and voltages, use the same command and filter:
sudo ipmitool sensor | grep -iE "fan|rpm"
sudo ipmitool sensor | grep -iE "volt|vcore"
To read the System Event Log (SEL), which is where hardware failures get recorded:
sudo ipmitool sel list
sudo ipmitool sel elist            # extended, includes timestamps and sensor numbers
sudo ipmitool sel info             # how many entries, how much space left
A SEL entry looks like:
   1 | 04/12/2026 | 14:23:07 | Fan #0x46 | Lower Critical going low | Asserted
   2 | 04/12/2026 | 14:23:15 | Power Supply #0xa8 | Failure detected | Asserted
The SEL is persistent. It survives reboots and BIOS updates. When it fills up, new events stop being recorded until you clear it:
sudo ipmitool sel clearCommon pitfalls
kipmi0 eating 100% CPU
The most common IPMI problem you'll encounter. The kipmi0 kernel thread polls the BMC for responses, and on some hardware, it polls too aggressively. You'll see one CPU core pegged at 100% in top, attributed to kipmi0, and the system will run warmer and consume more power than it should.
The fix is a kernel module parameter: kipmid_max_busy_us. It tells the kernel how many microseconds to busy-poll before yielding. The default behavior is to poll aggressively until an operation completes. Setting this to a lower value limits polling.
Temporary fix (resets on reboot):
echo 100 | sudo tee /sys/module/ipmi_si/parameters/kipmid_max_busy_usPermanent fix:
echo "options ipmi_si kipmid_max_busy_us=100" | sudo tee /etc/modprobe.d/ipmi.conf
sudo rmmod ipmi_si
sudo modprobe ipmi_si
Useful values are 100 to 500. Lower values mean less CPU used by kipmi0, but IPMI queries take longer to respond (potentially seconds instead of milliseconds). For monitoring at 60-second intervals, 100 is fine.
SEL log overflow
The SEL has a fixed size, typically 512 or 1024 entries depending on the vendor. If you don't clear it, old hardware errors pile up and eventually block new ones from being recorded. Worse, if you monitor SEL and get alerted on new entries, a full SEL means you stop getting alerted on new hardware problems.
Check periodically:
sudo ipmitool sel info | grep "Percent Used"When it hits 75%, clear it (after archiving the entries if you care about the history):
sudo ipmitool sel list > /var/log/ipmi-sel-$(date +%Y%m%d).log
sudo ipmitool sel clear
Vendor quirks
This is where IPMI gets genuinely annoying. The spec allows vendors a lot of interpretation, and they've each taken it in different directions.
Supermicro exposes the most sensors of any major vendor but is inconsistent about naming. A CPU temperature sensor might be CPU Temp, CPU1 Temp, Proc 1 Temp, or DIMM CPU 1 Temp depending on the board generation. Alerting by exact sensor name breaks when you swap hardware generations.
Dell iDRAC has a much cleaner sensor model but occasionally exposes discrete sensors in ways that confuse generic parsers. A PSU redundancy sensor, for example, might report state as a hex bitmask rather than a clean enum. Reading ipmitool sdr elist and parsing the discrete state text is more reliable than reading raw sensor data.
HPE iLO is the strictest about the spec and the most limited. Sensor readings are clean, but HPE locks down a lot of IPMI functionality behind iLO licenses and the ILO firmware. Some enterprise features (like SEL export) require a paid advanced license.
Ambient temperature sensor naming varies wildly: Inlet Temp, Ambient, System Ambient, Front Panel Temp. If you're trying to alert on ambient temperature (important for detecting HVAC issues), match on multiple name patterns.
Power supply sensors on servers with redundant PSUs report status differently across vendors. Some report per-PSU watts plus a "PSU Status" discrete sensor. Others only report status. Alerting on "any PSU not present" requires parsing the discrete status, not just the numeric reading.
IPMI over shared NICs
Many servers support a "shared NIC" mode where the BMC uses the same physical network port as the OS. This saves a switch port but creates a subtle problem: if your host firewall blocks the BMC's IPMI port (623/udp), you can't reach the BMC over the network. Worse, some providers configure this by default and don't tell you.
Check which NIC mode your BMC is using:
sudo ipmitool lan print 1 | grep -iE "IP Address|MAC|Channel"If the IP address is in your server's main subnet and the MAC address is the same as a system NIC, you're in shared mode. If the BMC has a separate IP in a management network, you're in dedicated mode.
What to alert on
Thirty-plus sensors per server means thirty-plus potential alerts. Most of them will never fire. Here are the handful that matter:
CPU temperature above 80 degrees C (warning) or 90 degrees C (critical). Modern CPUs will throttle themselves above about 95 degrees, and by then you're losing performance. 80 degrees is your "something is wrong with cooling" threshold. Don't alert on ambient temperature crossing CPU thresholds: exclude ambient/inlet/chipset sensors from CPU alerts. Bonus points for also alerting against the BMC's reported upper_critical threshold if it's lower than your absolute threshold (some servers are configured conservatively).
Fan RPM at 0 or below the vendor's lower_critical threshold. A dead fan doesn't always kill a server immediately, but it's a ticking clock. Critical alert, page someone.
PSU failure on servers with redundant PSUs. If you have N+1 power supplies and one fails, you're still running but a second failure brings down the server. Critical alert, but watch out for the Dell discrete-sensor parsing issue mentioned above.
Fan presence / PSU presence. Some servers let you detect when a module is physically removed. Useful for detecting maintenance mishaps.
ECC memory errors (correctable and uncorrectable). Correctable errors are a warning: the memory is degrading and should be replaced at the next maintenance window. Uncorrectable errors are critical and usually precede a kernel panic. Both are reported via IPMI on servers with ECC RAM, typically in a BIOS event or as discrete sensors like "Memory ECC" or specific "Correctable ECC Logging Limit Reached" entries.
SEL critical entries in the last 24 hours. Filter out informational entries and alert on anything marked critical or non-recoverable. The rule of thumb: a "Lower Critical going low" event on a fan or voltage is an alert.
BMC itself reachable. Sometimes the BMC firmware hangs or the ipmi_si module disconnects. Alert if ipmitool mc info fails to return for over 10 minutes.
What not to alert on: every non-critical sensor that the BMC flags. Modern servers set conservative thresholds and flag nc (non-critical) warnings for transient temperature spikes that happen during normal load. If you alert on every nc sensor, you'll silence the channel after the first night.
A minimal monitoring pattern
On your server:
- Install
ipmitooland load theipmi_devintfandipmi_sikernel modules at boot - Set
kipmid_max_busy_us=100in/etc/modprobe.d/ipmi.conf - Run a periodic collector that:
- Executes
ipmitool sensorand parses the output - Filters sensor names for CPU temperature (not ambient, not chipset)
- Checks fan RPM against lower_critical thresholds from the BMC
- Checks PSU discrete sensors for redundancy loss
- Reads SEL entries newer than the last check timestamp
- Filters SEL for critical and non-recoverable severity
- Clears the SEL when it exceeds 75% used (after archiving)
- Executes
- Send alerts to Slack, Telegram, email, or whatever channel you actually read
If you're doing this from scratch and running more than three or four servers, the collector quickly becomes the most interesting part of your infrastructure, and you're writing parsers for vendor quirks at midnight when you should be working on your actual product. This is why monitoring tools exist.
The 62 alert rules in Glassmkr (Crucible v0.13.6 at time of writing) include six rules in our hardware/BMC category that specifically target IPMI and BMC signals: CPU temperature with ambient exclusion, IPMI fan failure with BMC threshold awareness, PSU redundancy loss with Dell discrete-sensor parsing, ECC error tracking, MCE uncorrected events, and SEL critical severity with 24-hour windowing. Where a parser hasn't been validated against a vendor in production (some HPE iLO, OpenBMC, and Cisco UCS paths are parser_quality: "stub" today), Dashboard surfaces that as a soft "not yet observed on this hardware" rather than dressing it up as production-ready. You can try it free for three servers at glassmkr.com/docs. Or read the open-source agent source and roll your own. For the wider hardware-monitoring context, see our positioning post on the IPMI / SMART / RAID gap.
Either way: monitor your IPMI. Your hosting provider isn't going to do it for you.